
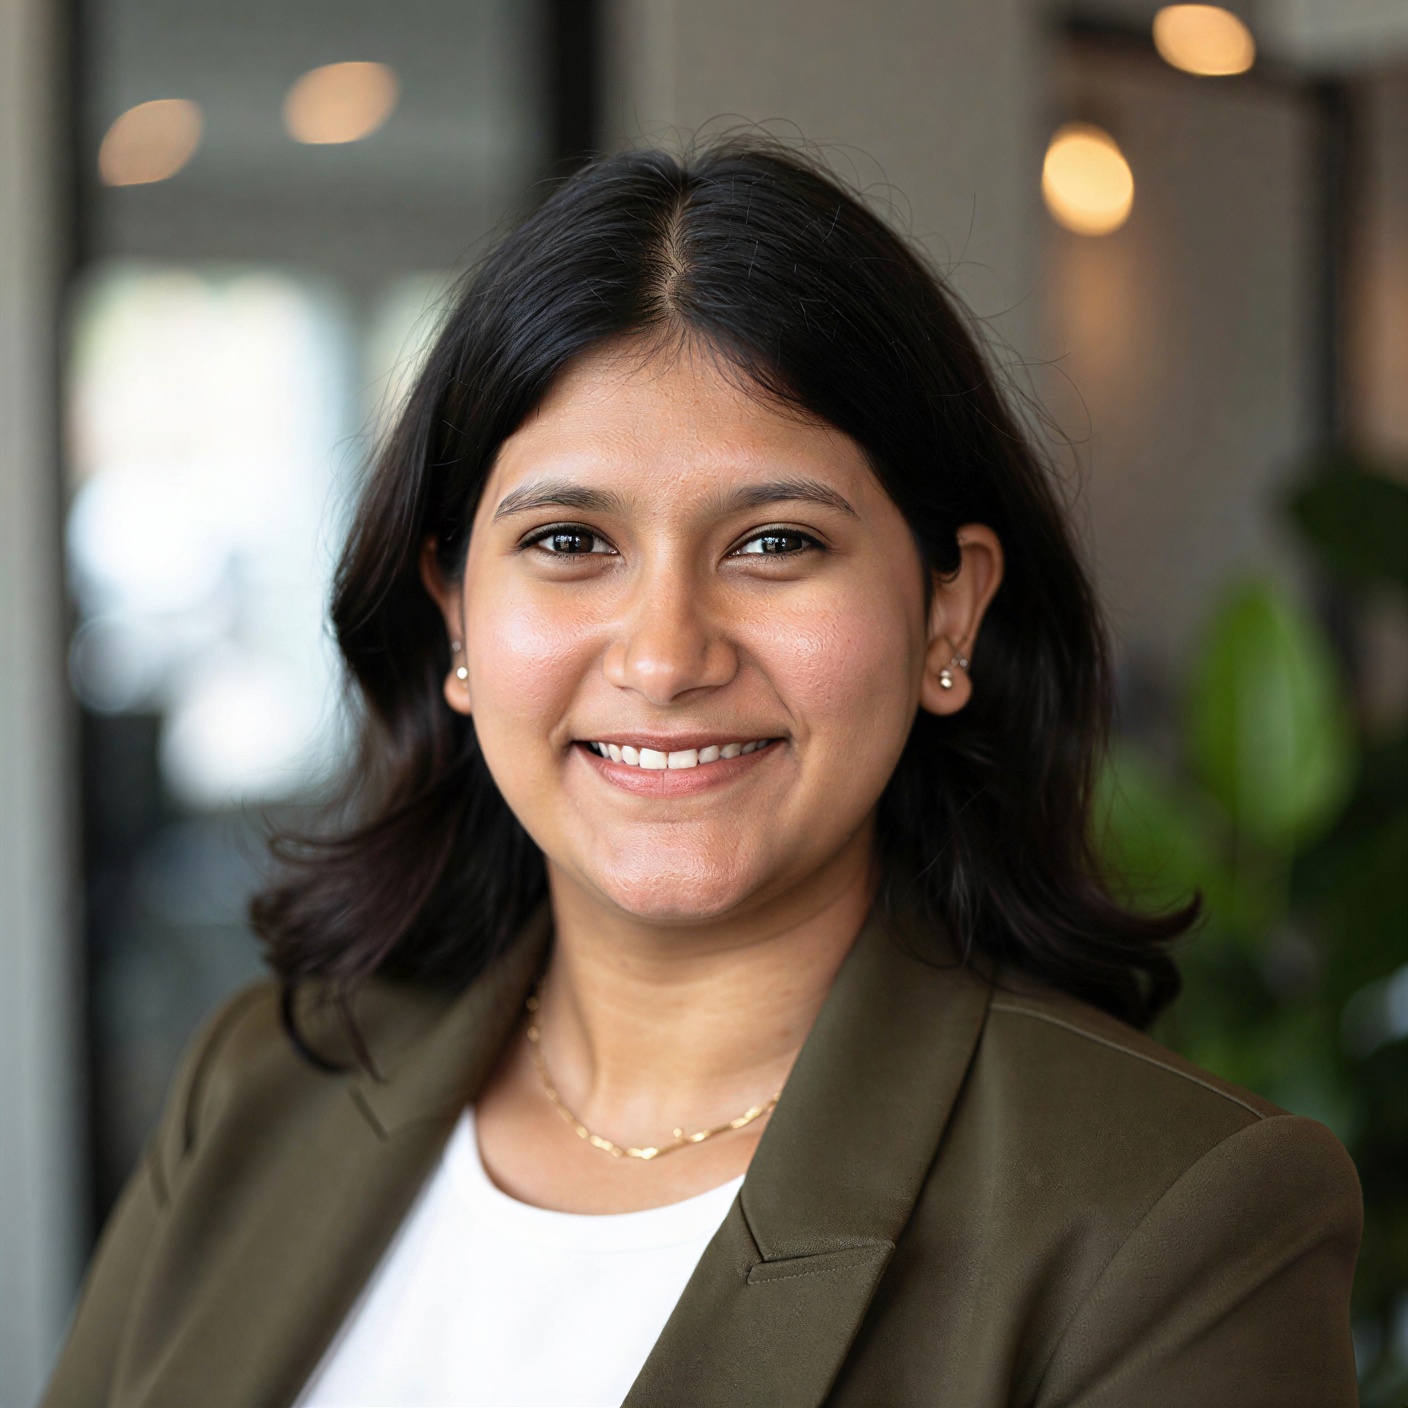
Siri Chandana
Ponnamaneni
An experienced data professional who turns complex data into reliable reports, intelligent models, and practical business solutions across business intelligence, operational analytics, financial data science, machine learning, and reporting automation.
Open to full-time opportunities in Data Analytics, Business Intelligence, Business Analysis, Reporting, Data Science, Machine Learning, AI, and Data Engineering in the United States.
Impact
Measurable outcomes across real projects.
4+
Years across analytics, BI, ML, and application systems
10,000+
Records processed across billing, engagement, and academic datasets
30%
Reduction in manual reporting time with automated dashboards
90%
Predictive model accuracy on financial data
01 About Siri Chandana
Analytical mind, human-centric communicator.
Data and AI professional with approximately four years of experience across application systems, operational and billing analysis, financial data science, business intelligence, dashboard development, reporting automation, and stakeholder-focused decision support.
Experienced in Python, SQL, Power BI, Tableau, Excel, Pandas, NumPy, Scikit-learn, relational databases, data visualization, predictive modeling, system testing, and data-quality management.
I hold a Master of Science in Data Analytics and Information Systems from Texas State University with a 4.0 GPA.
02 Skills
Tools I reach for.
A working toolkit across analysis, BI, data engineering, machine learning, and the systems that put it in front of people.
- Data Analysis & Business Intelligence
- Power BITableauExcelPower QueryDashboardsKPI ReportingData VisualizationOperational Reporting
- Programming & Data
- PythonSQLRPandasNumPyScikit-learnJupyterEDAData Cleaning
- Databases & Systems
- MySQLSQL ServerSQLiteRelational DatabasesApplication TestingData ValidationData MigrationSystems DocumentationIssue Investigation
- Machine Learning
- ClassificationRegressionClusteringFeature EngineeringPredictive ModelingModel EvaluationCross-validationRecommendation Systems
- Professional Skills
- Requirements AnalysisProcess ImprovementRoot-Cause AnalysisStakeholder CommunicationReporting AutomationTechnical DocumentationProject CoordinationPresentation of Findings
03 Experience
Analytics work across banking, utilities, higher education, and application systems.
Four years of experience across application systems, operational analytics, financial data science, business intelligence, machine learning, and reporting.
- September 2024 to May 2026
September 2024 to May 2026
01
Graduate Assistant, Data Analytics & Reporting
Texas State University, San Marcos, Texas
Analyzed student inquiry, enrollment, program, and operational datasets to identify trends. Built Power BI dashboards and automated Excel reporting workflows. Cleaned, standardized, and validated information from multiple sources, defined KPI logic and data-quality checks, and translated stakeholder needs into dashboards and analytical solutions.
Power BISQLExcelData Quality - April 2024 to July 2024
April 2024 to July 2024
02
Data Science Intern
Bank of America
Applied Python and SQL to prepare and validate anonymized financial datasets. Built and evaluated predictive models with scikit-learn using cross-validation, improved data quality through cleaning and reconciliation, and delivered reporting and visualizations for stakeholder review.
PythonSQLMachine LearningData Quality - February 2023 to March 2024
February 2023 to March 2024
03
Operations & Billing Analyst
Bharat Smart Services, Hyderabad, India
Analyzed customer, smart-meter, consumption, operational, and billing records using SQL, Python, Excel, and Power Query. Built validation processes for missing information, duplicates, unusual usage, and billing exceptions. Delivered dashboards and operational reports for billing performance, consumption trends, and exception tracking, and automated recurring data-cleaning and reporting workflows.
Power BISQLPythonOperational Reporting - May 2022 to January 2023
May 2022 to January 2023
04
Application & Data Systems Engineer
Nivahata Technologies, Hyderabad, India
Supported development, testing, and improvement of web applications and client-facing systems. Used SQL to query databases, validate records, and investigate issues. Performed functional, integration, regression, and user-acceptance testing, supported data migration and cleanup, and automated recurring validation and reporting using SQL, Excel, Power Query, and Python.
SQLApplication TestingData MigrationAutomation
04 Selected Projects
Dashboards, pipelines, models.
A selection of business intelligence, machine-learning, application systems, operational analytics, and reporting projects demonstrating technical execution and business impact.
Graduate Program Insights Dashboard
Institutional Power BI reporting layer for graduate program KPIs, built with cleaned and validated enrollment, inquiry, and operational data.
Billing and Consumption Intelligence Dashboard
Operational dashboards on 10,000+ smart-meter and billing records that surfaced consumption trends, billing exceptions, and data-quality issues.
05 Certifications
Certifications & professional development.




06 Education
Formal grounding in data science and analytics.
MS, Data Analytics & Information Systems
Texas State University
GPA: 4.0/4.0. Graduate coursework across analytics, statistical methods, information systems, and applied machine learning, alongside a Graduate Assistant role in institutional reporting.
B.Tech, Data Science
G. Narayanamma Institute of Technology and Science
Undergraduate program in data science covering programming, databases, statistics, and machine learning, complemented by applied roles across banking, utilities, and application systems.
07 What I Bring
How I work with teams and data.
The habits that make my dashboards, pipelines, and models useful past the demo.
Business Understanding
I connect technical findings with operational needs, KPIs, process improvements, and business decisions.
Technical Execution
I work across Python, SQL, Power BI, Tableau, Excel, databases, application systems, testing, and machine-learning workflows.
Reliable Reporting
I focus on data validation, repeatable reporting, clear metric definitions, and trustworthy outputs.
Communication
I present technical findings through dashboards, reports, documentation, and practical recommendations.
08 Contact
Let's build something useful with data.
I am open to full-time opportunities in data analytics, business intelligence, business analysis, reporting, application systems, and AI/ML. I am also interested in meaningful collaborations involving dashboards, automation, predictive analytics, and data-driven decision support.
siri2020chandana@gmail.com
Location
Texas, USA